Correct score predictions: how likely is any exact score?
See how a football model spreads probability across exact scores, why the top score is often below 15%, and how to read the market.

People searching for correct score today often see one result presented as the answer: 1–0, 1–1 or 2–1. A probability model sees something different. It assigns a share of probability to every plausible scoreline, and even the largest share is usually modest.
This guide shows how that distribution works. The numerical example is illustrative, based on the same simple independent-Poisson setup used in our mathematical-prediction explainer. It is not a current fixture, a live market price or a ProofPitch performance claim.
How a model spreads probability across exact scores
A goal model first estimates an average scoring rate for each team. It then converts those rates into probabilities for zero, one, two, three or more goals. Multiplying one team's goal probability by the other's creates a score matrix.
For this educational example:
- home expected goals: 1.55;
- away expected goals: 1.05;
- model: basic independent Poisson, before any low-score correction;
- settlement scope: an illustrative 90-minute score, including stoppage time but excluding extra time.
The Poisson probability for k goals at rate λ is e^-λ × λ^k ÷ k!. NIST describes Poisson as a distribution for the number of events in a fixed interval, with λ representing the average event count.[1]
Probability table for popular scores
| Rank | Exact score | Model probability | Fair decimal price* |
|---|---|---|---|
| 1 | 1–1 | 12.09% | 8.27 |
| 2 | 1–0 | 11.51% | 8.69 |
| 3 | 2–1 | 9.37% | 10.67 |
| 4 | 2–0 | 8.92% | 11.21 |
| 5 | 0–1 | 7.80% | 12.82 |
| 6 | 0–0 | 7.43% | 13.46 |
| 7 | 1–2 | 6.35% | 15.76 |
| 8 | 2–2 | 4.92% | 20.33 |
| 9 | 3–1 | 4.84% | 20.66 |
| 10 | 3–0 | 4.61% | 21.69 |
\*Fair price is 1 ÷ model probability, before market margin and rounded for display. It is a mathematical translation, not a price offered by a bookmaker.
The top score, 1–1, contains only 12.09% of the total probability. The first three scores together reach 32.97%; the first five reach 49.69%. More than half of the distribution therefore remains outside the model's five leading cells.
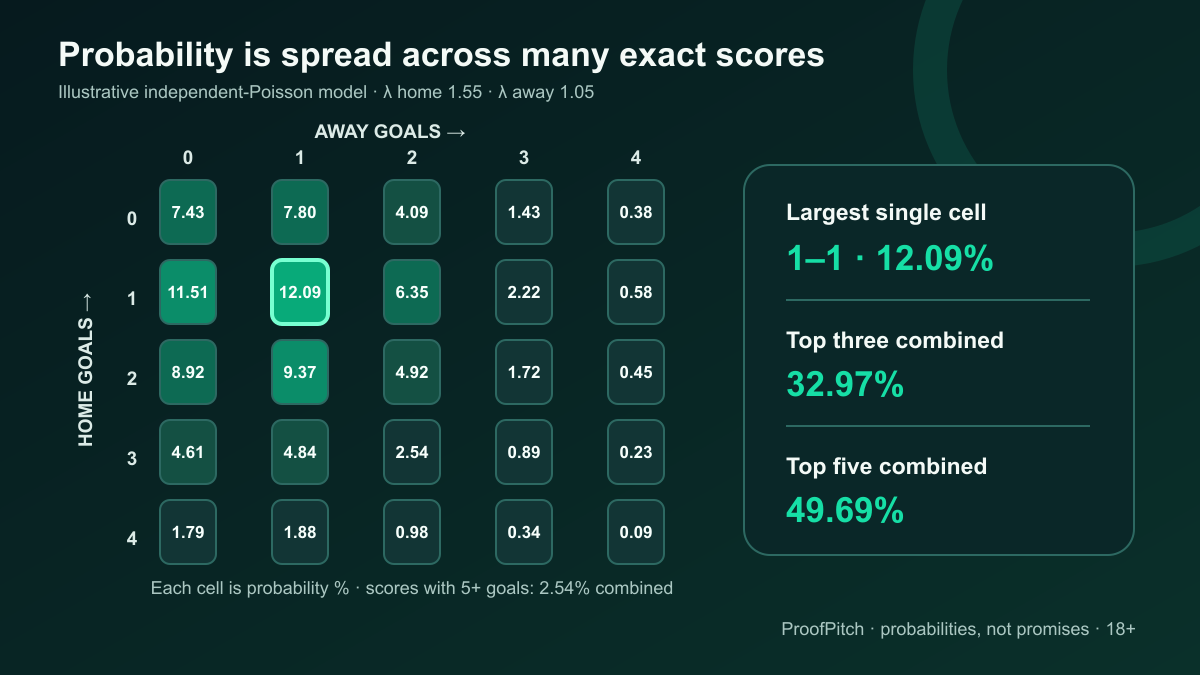
Figure 1. Illustrative independent-Poisson matrix. Rows are home goals and columns are away goals. Scores above four for either team are not displayed and carry 2.54% in total.
The entire matrix matters. If you publish only “1–1”, you hide how close the alternatives are: 1–0 is 11.51%, 2–1 is 9.37%, and several other cells remain plausible.
How the matrix creates broader markets
The same score cells can be added together to answer wider questions:
- home win: every cell where home goals exceed away goals;
- draw: the diagonal cells 0–0, 1–1, 2–2 and so on;
- away win: every cell where away goals exceed home goals;
- over 2.5 goals: every cell containing at least three total goals;
- both teams to score: every cell where each side scores at least once.
An exact-score prediction selects one cell. A 1X2 or totals probability combines many cells, so it will normally be much larger.
Why even the leading score is often below 15%
Football may be low-scoring, but it still has many plausible combinations. A match with an expected total near 2.6 goals can finish 0–0, 1–0, 0–1, 1–1, 2–0, 0–2, 2–1, 1–2, 2–2 and several less common ways.
Three forces keep the highest cell small.
1. Probability is divided twice
The home side's goals are uncertain, and the away side's goals are uncertain. An exact score requires both counts to be right simultaneously.
In the example, the home side has about a 32.9% chance of scoring exactly once and the away side about a 36.7% chance. Multiplying them gives approximately 12.1% for 1–1. Each individual goal count can look reasonable while their exact combination remains unlikely.
2. Nearby scores compete closely
The most likely score is simply the largest cell. It does not need to dominate the distribution. Moving one goal in either direction often creates a neighbouring cell with a similar probability.
A single goal can turn 1–1 into 1–0, 2–1 or 1–2. That makes the model's top score useful as a summary of the distribution's centre, but weak as a statement of what will happen.
3. Match events change the path
Red cards, penalties, injuries, deflections, tactical changes and game state can alter scoring behaviour. A basic independent-Poisson example assumes fixed goal rates and independence. Real football does not fully satisfy either assumption.
Dixon and Coles developed a football score model based on Poisson regression with adjustments for low-scoring outcomes and time-varying team strength.[2] More advanced models can improve the structure, but no method concentrates all uncertainty into one scoreline.
What “correct score prediction today” should include
A page labelled correct score prediction today is useful only if “today” is defined. Nigeria, Ghana and South Africa use different time zones, and fixtures near midnight can fall on different local dates.
For every displayed score, check for:
- fixture, competition and teams;
- calculation timestamp with timezone;
- market definition and settlement period;
- probability beside the score, not only the score itself;
- at least several leading alternatives;
- model version or method note;
- a complete result record containing misses as well as hits;
- a separate label for live forecasts and retrospective testing.
A page that refreshes during the day should preserve the original pre-match forecast in its public record. Otherwise, readers cannot tell whether the displayed score changed after team news or after the match began.
A daily list is not a performance report
Ten scores on one date are ten uncertain outcomes, not evidence that a method works. Correct-score performance should be evaluated across a large, consecutive sample using the published probability, not only the share of top picks that landed.
If a model assigns 10% to many exact scores, roughly one in ten should occur across a sufficiently large and comparable group if those probabilities are calibrated. A single hit does not prove quality, and a run of misses is compatible with low individual probabilities.
Live statistics answer how pre-match forecasts performed after publication. Retrospective checks answer how a fixed method behaved on a defined historical sample. ProofPitch keeps those datasets separate because they answer different questions.
When the correct-score market is informative—and when it is not
The score matrix can be useful even when no exact-score selection is made.
Useful as a map of the match
The distribution shows where the model places the match's centre and spread. For example:
- a cluster around 0–0, 1–0, 0–1 and 1–1 suggests a low-scoring shape;
- weight around 2–1, 2–2 and 1–2 suggests both sides have plausible scoring paths;
- a long home-scoring tail can reveal a strong home attack without pretending that one score is dominant.
This is more informative than displaying a single predicted number with no probability.
Potentially meaningful only with a price comparison
A model probability can be translated into a fair price. That number can then be compared with a current market reference after accounting for the market's margin and the time of observation.
ProofPitch keeps three concepts separate:
- model probability for the exact score;
- market reference recorded at a stated time;
- calculated card price, produced from the market-based reference with the documented 5% margin rule.
The calculated card price is not a live bookmaker quote. A current operator price can move and must be checked independently. A difference between model and market is also not proof that the model is right; it is a reason to investigate inputs and uncertainty.
Not meaningful when the score is isolated from its distribution
Avoid treating a score as evidence when:
- no probability is shown;
- only the winning examples remain visible;
- the market or 90-minute rule is undefined;
- the score was posted or changed after kick-off;
- a historical test is presented as live performance;
- an attractive price is quoted without source and timestamp;
- the language implies that one exact result is expected rather than merely the largest cell.
Operator rules can differ, so they must be read before any decision. As one documented example, Betfair states that its ordinary football markets use 90 minutes plus stoppage time and exclude extra time and penalties unless stated otherwise.[3] That example is not a universal rule for every provider.
How ProofPitch presents exact-score probabilities
ProofPitch treats the most likely score as one view of a probability distribution, not as a standalone promise.
A complete card or supporting view should make it possible to inspect:
- the fixture and exact market definition;
- expected-goal or model inputs that are approved for display;
- the leading scorelines and their separate probabilities;
- the calculation time and model version;
- market reference and calculated-price labels where applicable;
- the settled result in the public live record;
- retrospective model checks in a separate dataset.
Read how mathematical football predictions work for the full model pipeline. Then compare the live forecast record with retrospective checks without combining the two.
The educational matrix in this article uses a simple independent-Poisson calculation so every value can be reproduced. It does not claim to expose the complete production model or current match data.
Frequently asked questions
What is a correct score prediction?
It is a probability estimate for one exact full-time score, such as 1–0 or 1–1. A complete model produces probabilities for every plausible scoreline; the “prediction” usually refers to the largest individual cell.
Why is the most likely correct score only around 10–15%?
Because probability is spread across many combinations of home and away goals. The model must get both teams' exact totals right at the same time. The largest cell can therefore be much smaller than a home-win, draw or totals probability.
Is a 12% score prediction weak?
Not necessarily. It may be the natural maximum of a broad distribution. The useful questions are whether the probability is calibrated across many matches and whether nearby scorelines are shown, not whether one cell looks large.
How do I read correct score today pages?
Check the local date and timezone, publication time, settlement rule, probability, alternative scores and complete history. Do not evaluate the page from one day's winners alone.
How do correct-score markets usually settle?
Many ordinary football markets use the score after regulation time plus stoppage time, excluding extra time and penalties, but provider rules can differ. Read the exact market rules before participating, especially for knockout matches and specifically labelled extra-time markets.
How do I calculate a fair price for an exact score?
Divide one by the model probability written as a decimal. A 12% estimate gives 1 ÷ 0.12 = 8.33. This is a margin-free model translation, not a live quote and not evidence of a favourable opportunity by itself.
Is the top score better than the top-three score set?
They answer different questions. The top score identifies one cell; the top three describe a wider part of the distribution. In the illustrative example, the top cell carries 12.09%, while the top three together carry 32.97%. Combining scores would also require clearly defined settlement and pricing.
Can a model know today's exact football scores?
No. It can estimate a distribution from the information available before kick-off. The actual match remains uncertain, and late information can make an earlier calculation stale.
Read the distribution, not only the headline score
A correct-score model is most honest when it shows how uncertain the answer is. The leading score deserves attention because it is the largest cell—not because it is expected to happen more often than all other scores combined.
Open ProofPitch to inspect probabilities, timestamps and the public record around a forecast. Treat every exact score as one uncertain outcome inside a wider distribution.
18+ only. Participate only where legal. Gambling involves a risk of loss. Set time and money limits, never chase losses, and do not treat predictions as income, employment or financial advice. If gambling is causing harm, stop and contact an appropriate local support service.
Notes and sources
- NIST/SEMATECH. Poisson Distribution. Formula and interpretation of λ; checked 29 October 2026.
- Dixon, M. J.; Coles, S. G. Modelling Association Football Scores and Inefficiencies in the Football Betting Market. Journal of the Royal Statistical Society: Series C, 1997.
- Betfair Help. Football — 90 Minute Rule. Used only as a documented settlement example, not a universal operator rule; checked 29 October 2026.