Mathematical Prediction in Football: How It Works
See how mathematical football prediction turns goal rates into probabilities, calculated prices and a public record you can check before kick-off.

A mathematical prediction does not name the future. It estimates the chance of each possible outcome from the information available before a match. In football, that usually means turning team-strength and goal estimates into probabilities for a home win, draw, away win, totals, both teams to score and exact scores.
The useful question is therefore not, “Did the model pick the winner of this one game?” It is, “Were its probabilities well calculated, published before kick-off and reliable across many comparable games?”
This guide explains the calculation in plain English, including the Poisson and Dixon–Coles approaches, the difference between probability and price, and the checks you can make on any prediction platform.
The 30-second version 1. Estimate how many goals each team is expected to score. 2. Turn those estimates into a probability for every scoreline. 3. Add scoreline probabilities to produce 1X2 and other markets. 4. Test the probabilities on matches that were not used to fit the model. 5. Publish every forecast before kick-off and keep losses visible beside wins.
What a probability model actually calculates
Most goal-based models begin with two numbers: the expected goals for the home team and for the away team. These are not final-score predictions. They are average rates for this particular fixture.
A model may estimate those rates from:
- each team’s attacking and defensive strength;
- the quality of its opponents;
- home advantage;
- recent results, with older matches given less weight;
- league scoring levels; and
- confirmed inputs available at the calculation time.
The exact feature set can vary. More data does not automatically mean a better forecast: inputs must be available consistently, timestamped and tested without leaking future information into the past.
Poisson in plain English
The Poisson distribution converts an expected rate, written as λ (lambda), into chances of zero, one, two, three or more goals. Its probability mass function is:
P(k goals) = e^-λ × λ^k / k!
Here, k is the goal count. NIST describes Poisson as a distribution for the number of events in a fixed interval and identifies λ as the average event count.[1]
Suppose an illustrative model estimates:
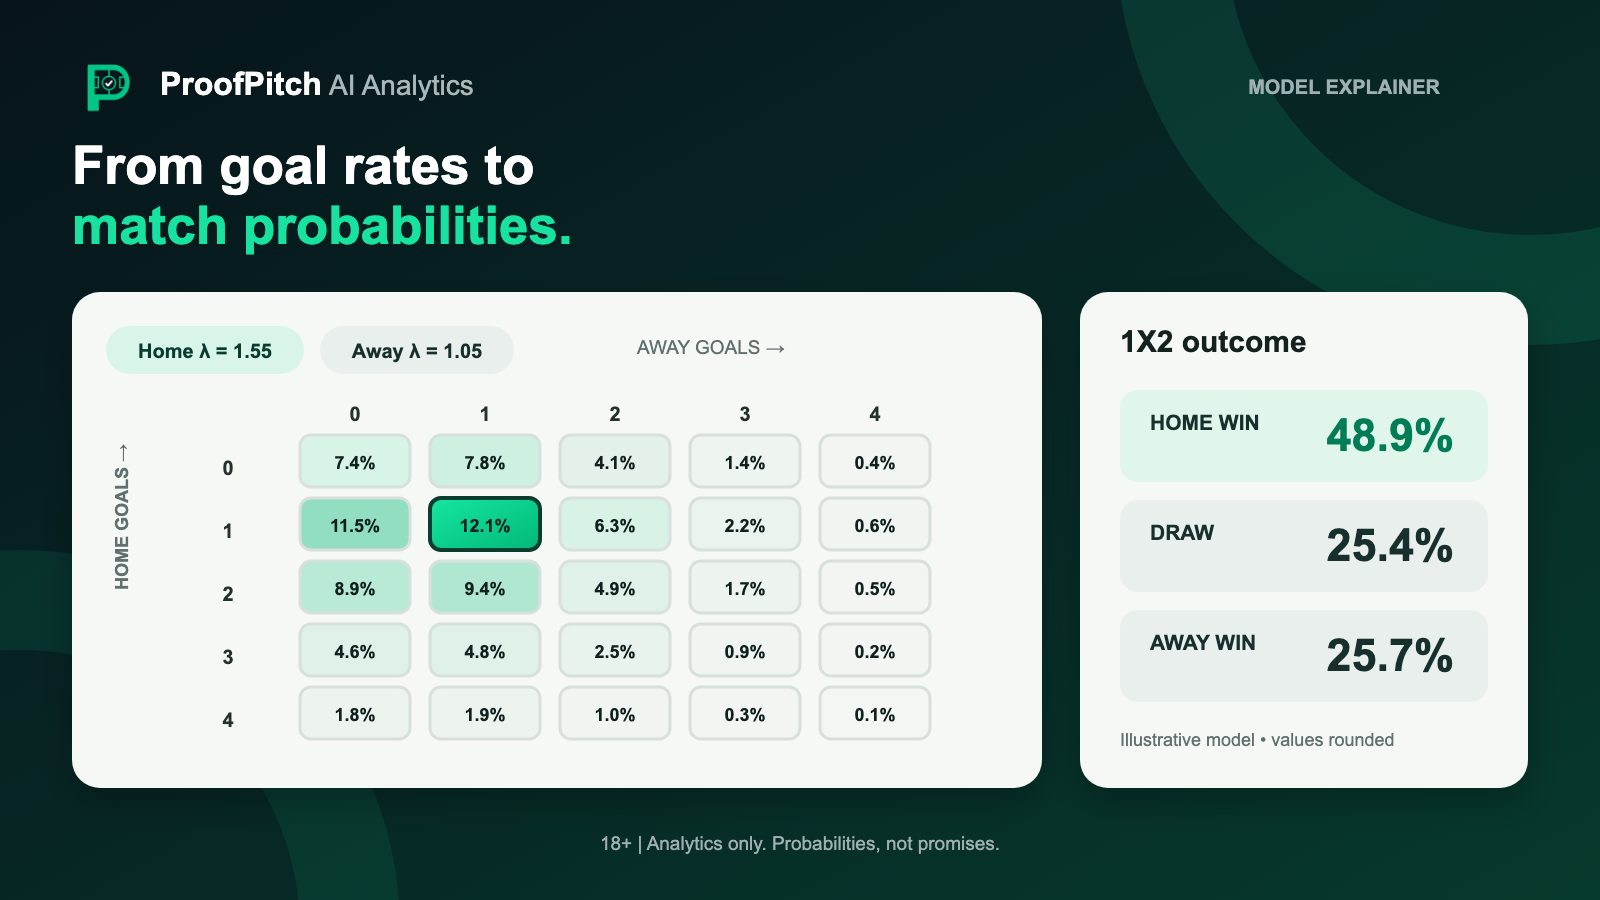
- Home expected goals: 1.55
- Away expected goals: 1.05
A basic independent-Poisson calculation gives the following goal probabilities:
| Goals | Home team | Away team |
|---|---|---|
| 0 | 21.2% | 35.0% |
| 1 | 32.9% | 36.7% |
| 2 | 25.5% | 19.3% |
| 3 | 13.2% | 6.8% |
Multiplying the home and away probabilities creates a score matrix. For example, the basic probability of 1–0 is 32.9% × 35.0%, or about 11.5%. Adding every cell where the home score is higher produces the home-win probability. In this example, before any low-score correction, the rounded 1X2 output is:
| Outcome | Model probability | Model fair price (1 ÷ probability) |
|---|---|---|
| Home win | 48.9% | 2.05 |
| Draw | 25.4% | 3.93 |
| Away win | 25.7% | 3.89 |
These are three possible outcomes of the same model and sum to approximately one, allowing for rounding. The most likely outcome is still below 50%, which is a useful reminder: “most likely” and “certain” are completely different ideas.
What Dixon–Coles changes
The independent Poisson model is simple and useful, but football scores are not perfectly independent. A goal changes game state, and low-scoring results can behave differently from the basic assumption.
The Dixon–Coles model, introduced in a 1997 paper, starts with Poisson goal rates and adds a correction around four low-score cells: 0–0, 1–0, 0–1 and 1–1. It also allows recent matches to carry more weight than older ones.[2] The aim is not to rewrite the whole score matrix. It is to correct a known weakness while preserving an interpretable model.
Other approaches may use bivariate Poisson models, Elo-style ratings, expected-goals data, Bayesian models or machine learning. The label matters less than out-of-sample evidence. A complex model can still be poorly calibrated, and a simple model can still be useful if its scope is clear.
Calibration is not the same as picking winners
A probability model should be judged across a group of forecasts. If events assigned about 60% probability occur about 60 times in 100 comparable cases, that probability band is well calibrated. A reliability diagram compares average predicted probability with the observed event rate.[3]
That does not mean every 60% forecast succeeds. It means failure should occur roughly 40% of the time over a sufficiently large and relevant sample. One match is an outcome; calibration is a property measured across many forecasts.
Useful evaluation also includes proper scoring rules such as log loss or the Brier score. Hit rate alone can mislead because always selecting a short-priced favourite may create many correct picks without showing whether the quoted probabilities were informative or fairly priced.
From probability to price: why our price is a calculation, not a bookmaker quote
Probability and decimal price are two ways to express the same starting idea:
- A model probability of 50% has a fair price of 1 ÷ 0.50 = 2.00.
- Decimal odds of 2.50 imply 1 ÷ 2.50 = 40% before adjustments.
But displayed bookmaker odds are not pure probabilities. The set of implied probabilities will commonly add to more than one because a margin is built into the market. Prices can also move as information and demand change.
ProofPitch keeps three numbers conceptually separate:
- Model probability — the model’s estimate for the event.
- Market probability or price — the comparison signal derived from the market.
- Calculated card price — a reference calculation based on the market with the specified 5% margin applied.
The calculated card price is not a bookmaker quote, is not necessarily available for a transaction and should not be presented as one. Its purpose is consistent model-versus-market comparison. Before acting on any information, a user would need to check an authorised provider’s current terms and price independently.
Prediction card reading order Check the event and market → read the model probability → note the calculation timestamp → compare with the market reference → inspect the public record and limitations.
Two models can agree on the most likely team and still disagree on price. A 55% home-win estimate implies a fair price near 1.82. If the market’s margin-adjusted probability is 60%, the model is actually less confident than the market. The team name alone hides that information.
How to verify any prediction site
An attractive percentage is not evidence by itself. Use this checklist before trusting a mathematical football prediction or mathematical soccer prediction service.
1. Look for a complete public log
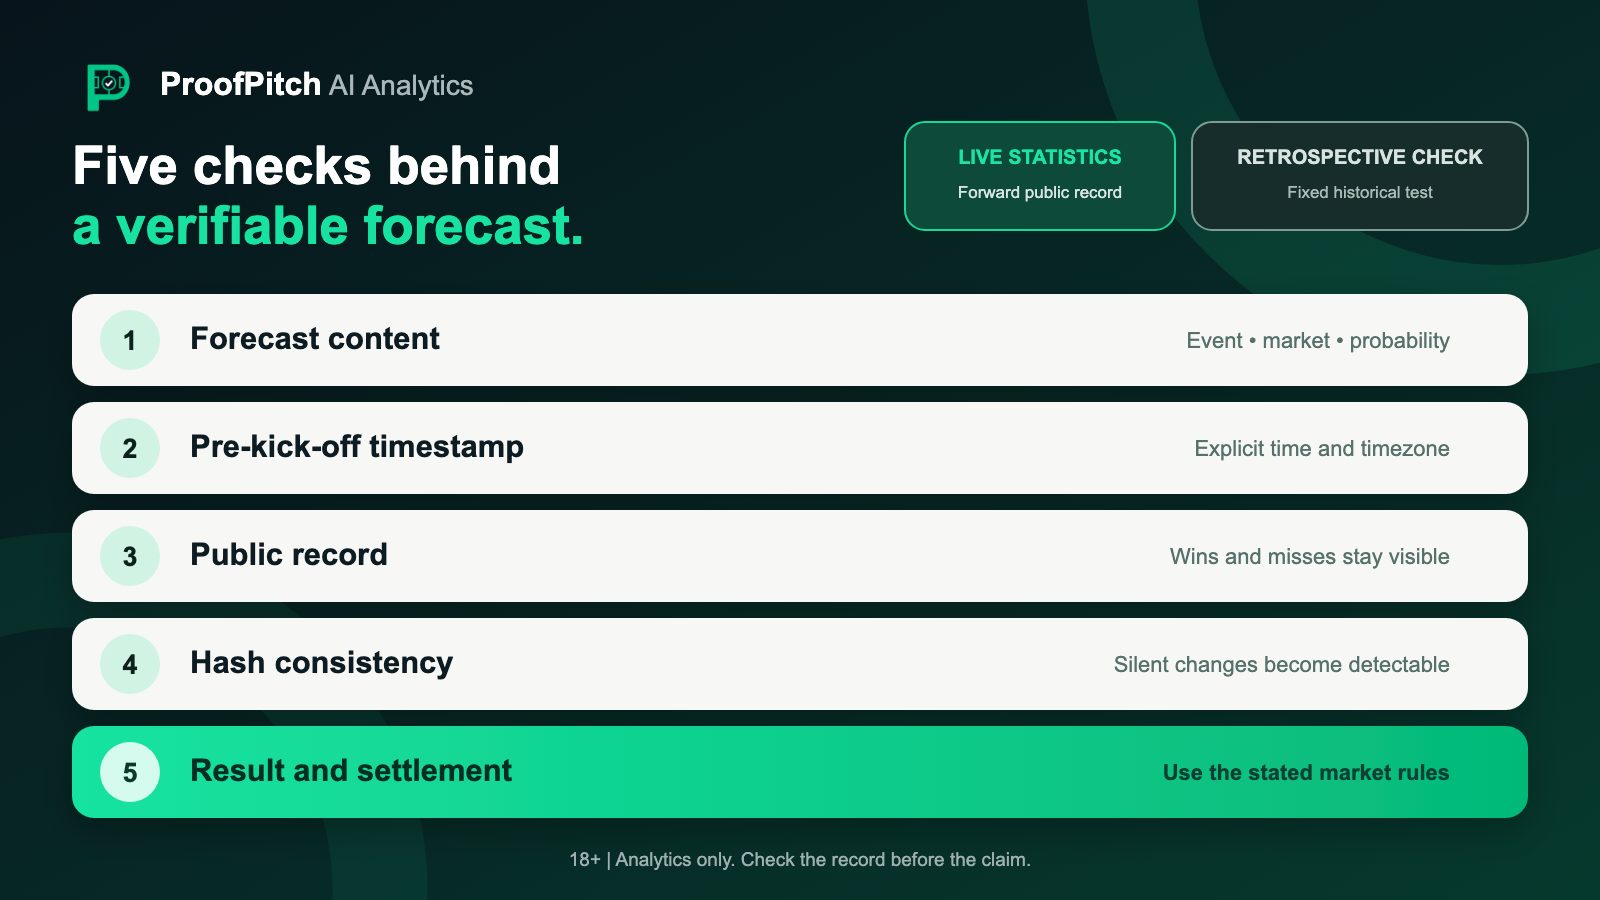
The record should include all eligible forecasts, not only selected wins. It should show the fixture, market, probability, calculation time, result and settlement rule. Filters should not silently remove losses, voids or older periods.
2. Confirm the timestamp is before kick-off
A forecast is testable only if its content was fixed before the event. The page should show the relevant timezone and the timestamp used for the prediction. In Nigeria, South Africa and Ghana, readers may be viewing the same match in different local times, so an explicit timezone is more reliable than “today”.
3. Check what the hash proves
A hash is a compact fingerprint of data. Change the data and the fingerprint changes. In a hash chain, each entry also refers to the previous entry, so rewriting an older record breaks the links that follow it.
This makes silent editing detectable when readers can compare the published hashes or anchors. Append-only transparency systems use related Merkle-tree techniques to prove inclusion and consistency between log states.[4]
A hash alone does not establish when a prediction existed. The stronger setup combines:
- the forecast content;
- a pre-kick-off timestamp;
- a public, append-only log;
- a verifiable hash or chain; and
- an external publication or anchor that was visible at the time.
4. Keep live statistics separate from retrospective checks
Live performance statistics answer, “How is the current published set performing?”
Retrospective model checks answer a different question: “How would a fixed model version have performed on a defined historical sample?”
They must not be merged. A backtest can help evaluate a method, but it is vulnerable to overfitting if the model was repeatedly tuned on the same history. A live forward record tests forecasts as they are actually published.
5. Inspect calibration and sample size
Ask whether a site reports performance by probability band, league and market. A model may be well calibrated overall but weak in a competition with sparse or delayed data. Small samples create wide uncertainty, so a short winning run says little about long-term quality.
6. Compare like with like
The forecast, market definition and settlement result must match. “Over 2.5 goals” cannot be scored as “over 1.5”, and a full-time 1X2 forecast cannot be settled using extra time. Also check that the reference price was recorded at a stated time rather than selected later.
What a model cannot do
No mathematical prediction removes football’s uncertainty. A responsible model has clear limits.
It cannot use information it does not have
Late lineup changes, injuries that are not public, travel disruption, pitch conditions, tactical changes and data errors can all move the real probability. The timestamp tells you which information could have been included.
It cannot make one match behave like an average
The model describes a distribution of possible outcomes. A red card, deflection or missed penalty can decide a single match without showing that the earlier probability was unreasonable.
It cannot transfer equally across every league
Data availability, reporting speed, competition format and scoring patterns vary by league. That matters for domestic competitions and international fixtures followed by readers in Nigeria, South Africa and Ghana, just as it does elsewhere. Coverage should be assessed competition by competition rather than making one claim for an entire continent.
It cannot turn accuracy into profit
Forecast quality, price and financial outcome are separate. Even a well-calibrated model may not outperform a competitive market after margins, price movement and execution constraints. A high hit rate can also be produced by low-return selections. Evaluate probabilities and prices, not slogans.
It can become stale
Team strength changes. Promoted clubs, new managers, transfers and schedule changes can make older data less relevant. Models need a documented update process, version history and monitoring for calibration drift.
A practical way to read the next forecast
When you open a prediction, take one minute to answer five questions:
- What exactly is the event being forecast?
- What is the model probability, not just the selected outcome?
- When was the forecast calculated and published?
- Is the displayed price a model calculation, a market reference or a live quote?
- Can you see the full record, including unsuccessful forecasts?
That habit turns mathematical predictions football pages from a list of picks into something testable. It also makes comparisons fairer: model versus market, forecast versus result, and past calibration versus future monitoring.
Frequently asked questions
How accurate is a maths prediction?
There is no single accuracy figure for all mathematical predictions. Performance depends on the league, market, data, model version and evaluation period. Check calibration, proper scoring rules, sample size and a complete pre-kick-off record. A single correct or incorrect match is not enough to evaluate a probability model.
Can a mathematical football prediction be free?
Yes. “Free” describes access, not forecast quality. A free model can be transparent and well tested; a paid service can still be poorly documented. Check the current access terms in the ProofPitch app and judge the method by its public evidence.
How often is a football probability model updated?
There is no universal schedule. Inputs may update after new results, confirmed team news or market movement, while model parameters may be retrained less often. The important controls are a visible calculation timestamp, a model-version label and a record of what changed. Always read the timestamp on the individual forecast.
What is the difference between a probability and a match result?
A probability describes uncertainty before kick-off; the result is one realised outcome afterward. A 30% event will often fail, but it should still occur around 30% of the time across many comparable, well-calibrated forecasts.
Why can the model and the market disagree?
They may use different data, update at different times or weight information differently. The market also includes margin and can react to demand. Disagreement is a signal to investigate, not proof that either side is correct.
Check the numbers, not the claim
ProofPitch is designed around transparent comparison: model probability beside the market reference, with a timestamped journal that can be checked after the result. Open the app to inspect the next calculation and its place in the public record.
18+ only. Participate only where legal. Set limits, never chase losses and use prediction data as information rather than financial advice. If betting is causing harm, stop and seek support through an appropriate local service. Any partner link must be clearly labelled as an affiliate link.
Notes and sources
- NIST/SEMATECH, “Poisson Distribution”, Engineering Statistics Handbook: https://www.itl.nist.gov/div898/handbook/eda/section3/eda366j.htm
- Dixon, M. J. and Coles, S. G. (1997), “Modelling Association Football Scores and Inefficiencies in the Football Betting Market”, Journal of the Royal Statistical Society: Series C, 46(2), 265–280. DOI: https://doi.org/10.1111/1467-9876.00065
- Scikit-learn documentation, “Probability calibration” and calibration curves: https://scikit-learn.org/stable/modules/calibration.html
- IETF RFC 9162, “Certificate Transparency Version 2.0”, append-only Merkle trees and consistency proofs: https://www.rfc-editor.org/rfc/rfc9162.html